
As a follower of XKCD comics, I knew I needed to try the matplotlib XKCD style. I’ll use it to plot the evolution of the percentage of deep-learning papers in the major computer vision conferences (see my series of posts).
And here the plot:
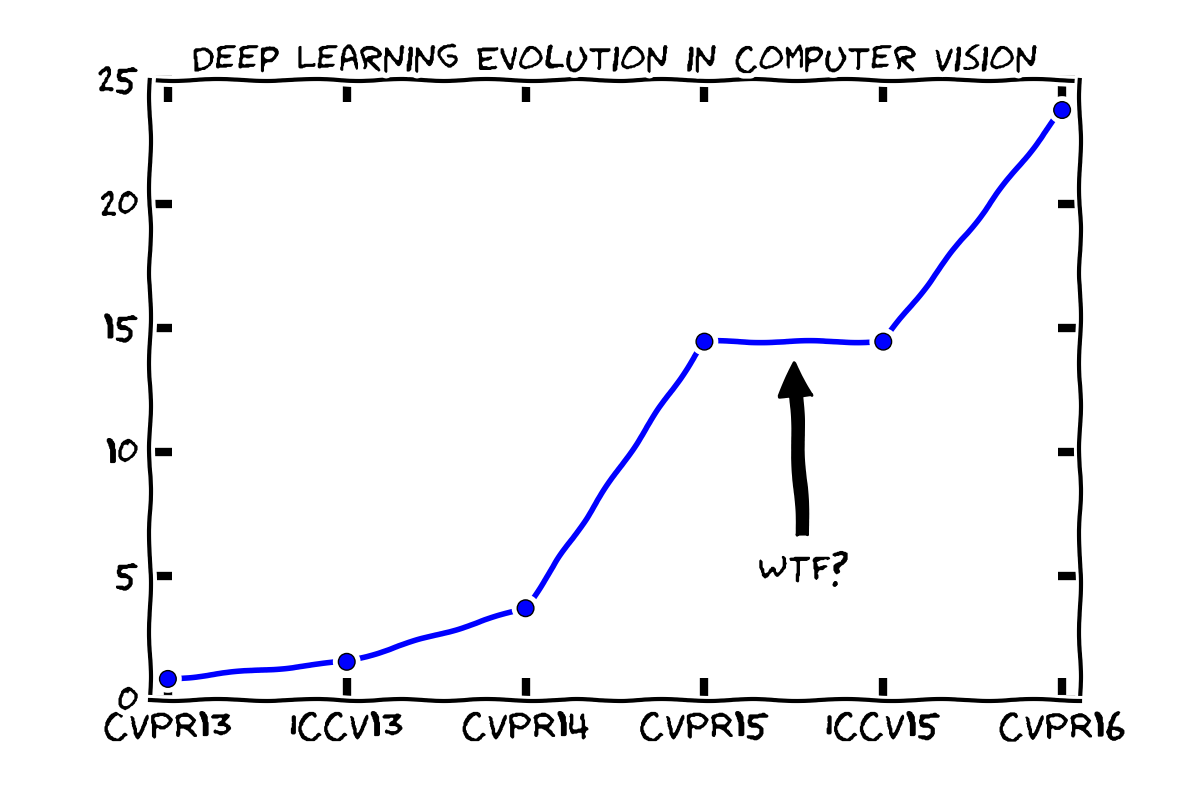
Awesome, right? I’m even considering it for my next CVPR submission. :) Here the code for you to try:
#!/usr/bin/env python
# -*- coding: utf-8 -*-
import matplotlib.pyplot as plt

# Data to plot
conferences = ["CVPR13","ICCV13","CVPR14","CVPR15","ICCV15","CVPR16"]
percents = [0.85, 1.54, 3.70, 14.45, 14.45, 23.79]
xval = range(0, len(percents))

# Set the style to XKCD
plt.xkcd()

# Plot the percents
plt.plot(xval,percents, marker='o')

# Annotate and fine-tune
plt.title("Deep Learning Evolution in Computer Vision", fontsize=13)
plt.annotate('WTF?', xy=(3.5, 14), xytext=(3.3, 5), arrowprops=dict(facecolor='black', shrink=0.05))
plt.xticks(range(0, len(percents)), conferences)

# Fine-tune the axis
ax = plt.gca();
ax.set_axisbelow(True)
ax.set_xlim([-0.1, 5.1]);

# Show and save
plt.savefig('foo.png',dpi=200)
plt.show()